When looking at a potential investment, it’s important to understand the investment so you can understand the risks involved. This is especially true with investments that have a higher than average rate of return. The reason is that these investments potentially have a higher than average risk level. I decided to do a thorough analysis and performance review of the leveraged ETF TQQQ. Out of all of the leveraged ETF’s available, this is probably one of the more popular ones. So I thought that sharing my findings would be helpful to others considering delving into this ETF. If you’re not sure what a leveraged ETF is, we have an article on “What Is A Leveraged ETF?”
What is TQQQ based on?
TQQQ is a 3x leveraged ETF designed to have daily returns that are 3 times the return of the Nasdaq 100. If you’re familiar with how leveraged ETFs work, this means it goes up or down 3 times as much as the Nasdaq 100 in a single day. This same performance won’t be the case over a longer period of time. Obviously this means a higher level of risk, but also potential of a higher rate of return.
How has TQQQ performed since it launched?
TQQQ was launched on February 10th, 2010. The original share price was $78.72. The closing price as of December 10th, 2024 was $84.76. This may not seem like much of a change over almost 15 years. The thing to be aware of is that TQQQ has gone through numerous splits over that time period. There have been 6 times that it had a 2 for 1 split. There was also one time that it had a 3 for 1 split. So to get an equivalent price to compare apples to apples, we would need to divide the original price by 192. I determined this by multiplying for each split: 2x2x2x2x2x2x3. So the equivalent price when the ETF first opened would have been 41 cents per share.
Given that, TQQQ has averaged over the 178 months since it launched an average annual rate of return of 36.486%. That’s a fairly good track record if someone were to have bought and held during that time frame. So say someone had invested $10,000 into TQQQ on the day it opened and purchased 127 shares. 14 years and 10 months later that investment would have 24,384 shares with a value of $2,066,787.84.
If we could know that this ETF would consistently perform like this in the future, it would certainly be a good investment to have for the long term. We actually need to go further back in time to see how TQQQ would have performed through some of the larger downturns in the market. As always when looking at historical returns, it’s important to remember that past performance doesn’t guarantee future results. So even though the past can give us some insight, it can’t predict what path the market will take in the future.
How do long term returns on TQQQ compare to QQQ?
The answer to this question really depends on what time period you’re looking at. Since TQQQ wasn’t launched until February 10th, 2010, it’s a fairly new ETF compared to some. QQQ started in 1999 so it’s been around for quite a bit longer than TQQQ. For this reason it has more of a track record. Even though there has been a relatively short history on TQQQ, because we know how it performs compared to the Nasdaq 100, we can simulate the performance. The Nasdaq 100 index was started October 1st 1985.
We’ll use the assumption that TQQQ would perform 3x the return on a daily basis of the Nasdaq 100. From this we can see what each of them would have done since the Nasdaq 100 index was launched. I’m going to use the time frame of 10/1/85 to 9/30/2024, so a period of 39 years. Because the QQQ is designed to mirror the returns of QQQ, we’ll assume the performance of the Nasdaq 100 index would be the same as QQQ.
NASDAQ 100
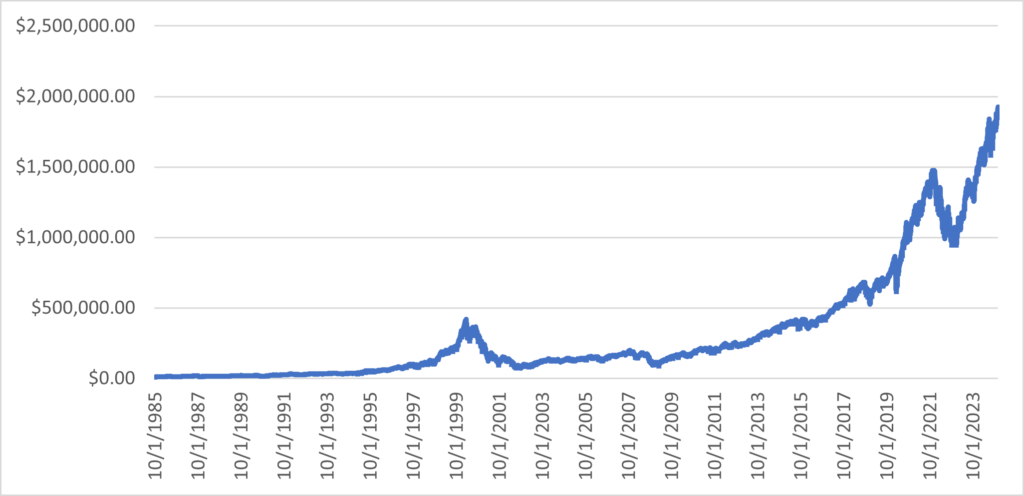
During this specific 39 year period the NASDAQ 100 averaged an annual return of 13.373%. That is better than the S&P 500, but there also is more volatility in the NASDAQ 100 than in the S&P 500. The starting price of the NASDAQ on 10/1/85 was $112.14 and the closing price of the NASDAQ on 9/30/24 was $20,060.69.
So if you purchased 89 shares at $112.14 per share on 10/1/85, the cost of those shares would be $9,980.46. I just used the number of shares that $10,000 could buy as an example. After 39 years those same 89 shares would be worth $1,785,401.41. That’s a reasonable return on a $10,000 investment. There was a fair amount of volatility over that time period. When you think about what happened when the dot com bubble burst in 2000-2002, there was quite a drop in the NASDAQ 100 index. The chart below shows the value of the initial investment over 39 years. (Data taken from NASDAQ 100 Historical Pricing on Yahoo Finance)
TQQQ
Now if we were to look at this same time frame with what TQQQ would have done based on the assumptions, the chart looks a bit different. At the end of the 39 years the TQQQ value is much higher than the NASDAQ 100 value, but there are some interesting things to consider when delving into the details. But just looking at the starting and ending numbers looks fairly good. Starting with the same 89 shares at a share price of $112.14 and applying the 3x return of the NASDAQ 100, we end up with a value after 39 years of $23,127,863.23. This is an average annual return of 20.032%.
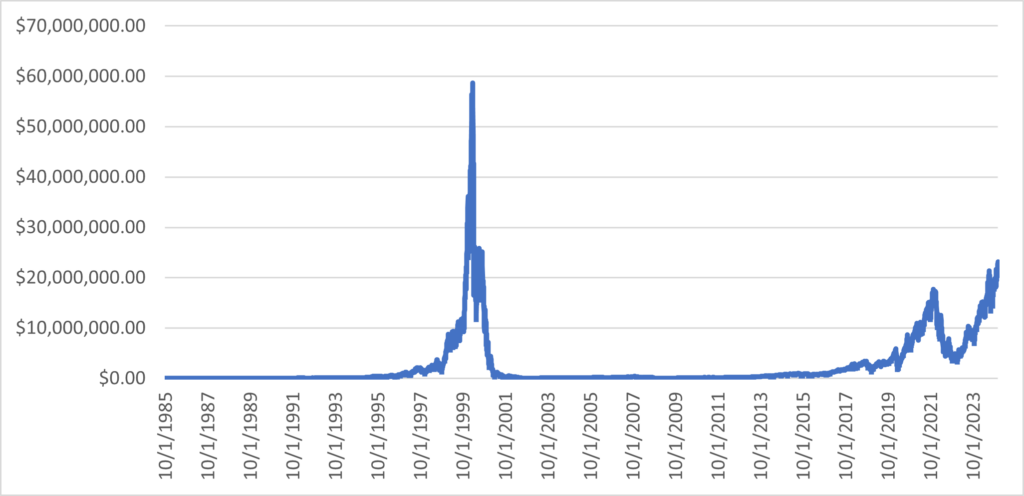
There is probably one thing that is the most noticeable when you look at the broad picture of the entire 39 year period. There is a huge spike in the value in 1999 and early 2000 and then the huge drop. You’ll also notice that value still hasn’t recovered from the high it reached in March of 2000 when it reached nearly 60 million dollars.
Now you may think that a 20% return still is pretty good, you have to look at the fact that after the drop from the dot com bubble burst, it struggled to make much progress for the next few years and still hadn’t recovered much of it’s loss when the financial crisis of 2008 struck. We’ll look at this in a little more detail later in the article.
Annual Returns
When looking at this chart, the thing you have to consider is how long it takes for the value to recover after a big loss. Another thing we can look at is a chart of the annual returns of both TQQQ and the NASDAQ 100. I’m using the year ending on October 1st of each year since that is the start and ending date of our evaluation.
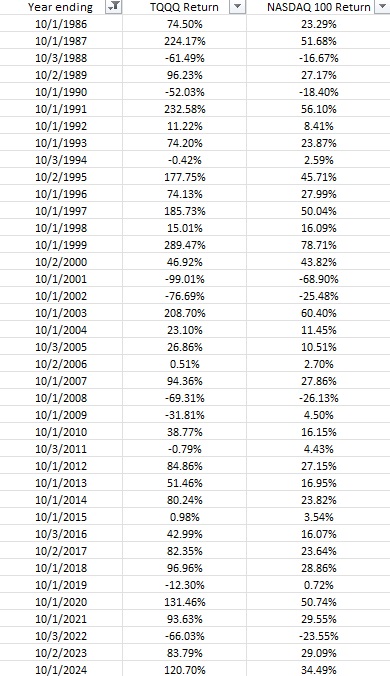
You can see from the chart that for TQQQ the returns for most of the years are either up a lot or down a lot. The decade from 1991 to 2000 had a fairly consistent run of good years. Also the time period between 2010 and 2021 was a period of good growth. Where things really get off track is when there is a big drop such as in 2001 to 2002 and the years 2008 and 2009. Next we’re going to dive into the details of these big drops in the market and how it affected things overall.
Stock Market Crash of 1987
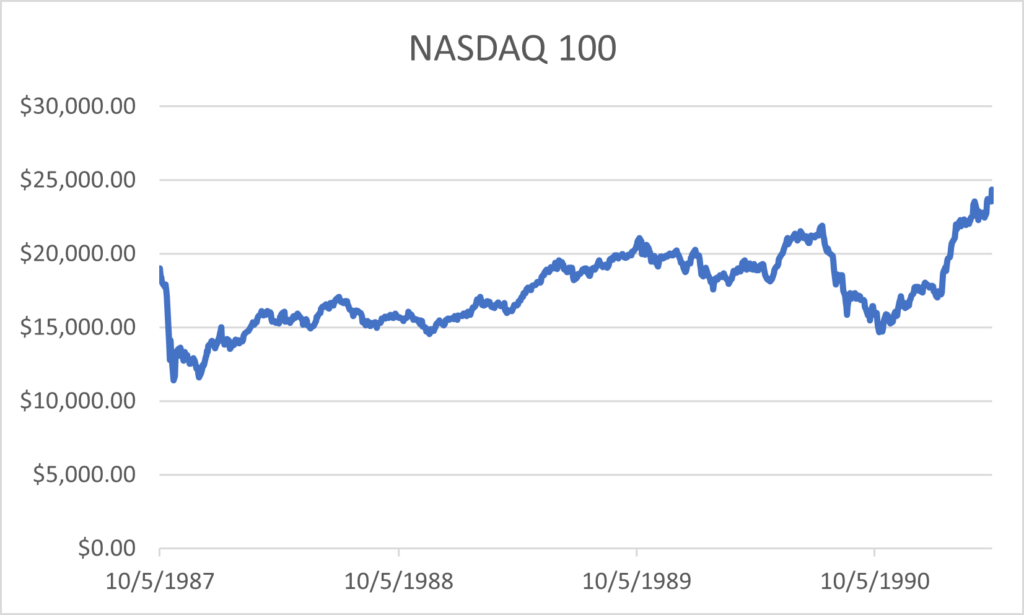
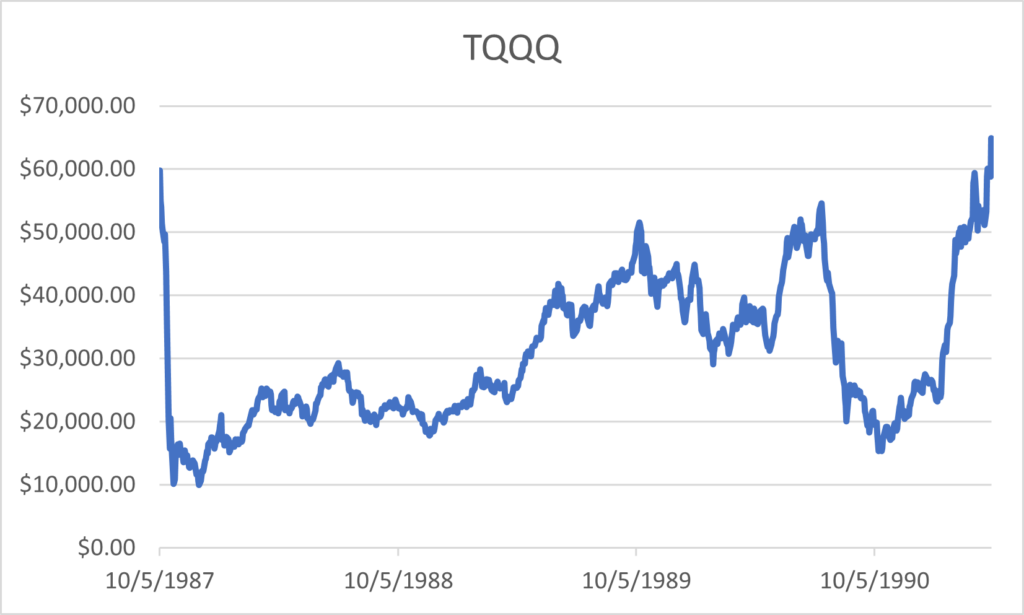
In just 2 years and a few days after the NASDAQ 100 was launched the NASDAQ 100 index had grown by 90.66%. This is almost double in about 2 years by October 5th, 1987. TQQQ would have grown by just shy of 500% during that time. Going back to our example of a $10,000 investment in each, the NASDAQ 100 investment would have been worth $19,029. Our TQQQ investment would have been worth $59,797.
Black Monday of 1987
Over the next two weeks the market would have almost all down days culminating in a 15% drop in one day in the NASDAQ 100 on what is referred to as Black Monday on October 19th, 1987. So of course the TQQQ would have dropped by about 45% on that day alone. Following that the market went through a turbulent period of large swings and found a bottom on December 4th of that year. Our NASDAQ 100 investment would have gone from $19,029 on October 5th to $11,850 on December 4th. Our TQQQ investment would have gone from $59,797 to $9,983 during that same time period. All of the gains from the previous two years would have been wiped away in about two months.
The thing you’ll start to see is that when there is a large drop like this it typically takes TQQQ much longer to reach it’s previous high than the NASDAQ 100. The way to illustrate this is to use this example from 1987. Our NASDAQ 100 investment would have recovered it’s losses to a new all time high by May 26th, 1989. It would take until April 4th of 1991 for our TQQQ investment to reach a new all time high following the drop. You can see in the following charts how much bigger the swings are for TQQQ than for the NASDAQ 100.
Recovery Time
The reason that it takes so much longer for TQQQ to recover is that it takes a much larger percentage gain to come back from a large drop. The NASDAQ 100 had less than a 50% drop. To recover to it’s previous high it had to go up less than 100%. TQQQ had a drop of about 83%. For TQQQ to recover it would take almost a 500% increase. You’ll see this in an even bigger way in the next big drop which was the burst of the dot com bubble.
The Bursting of the Dot Com Bubble
When doing a performance review on TQQQ, the biggest event in relatively recent history would be the burst of the dot com bubble. The decade of the 1990’s was a relatively good time period for the stock market and especially so for technology stocks. By December of 1996 our TQQQ investment would have first reached a value of a million dollars. At that same point, our NASDAQ 100 investment would have reached approximately $75,000. The big acceleration in technology stocks occurred during 1999 and early 2000. It had reached a peak on March 27th, 2000.
On that day our TQQQ investment would have been worth $58,711,990. The NASDAQ 100 investment would have been worth $418,720. Most investors weren’t prepared for what would happen during the following couple of years. Technology stock prices had grown much more in value than the fundamental values of the companies. This was partly caused by investors driving up the prices. This couldn’t be sustained.
The market drop finally hit a bottom on October 7th, 2002. Our NASDAQ 100 investment would then be worth $71,612. This is a drop of almost 83% from the high on March 27th, 2000. Our TQQQ investment would have been worth $34,046. This is a drop of 99.94% over that same time period. Here are charts showing this time period.
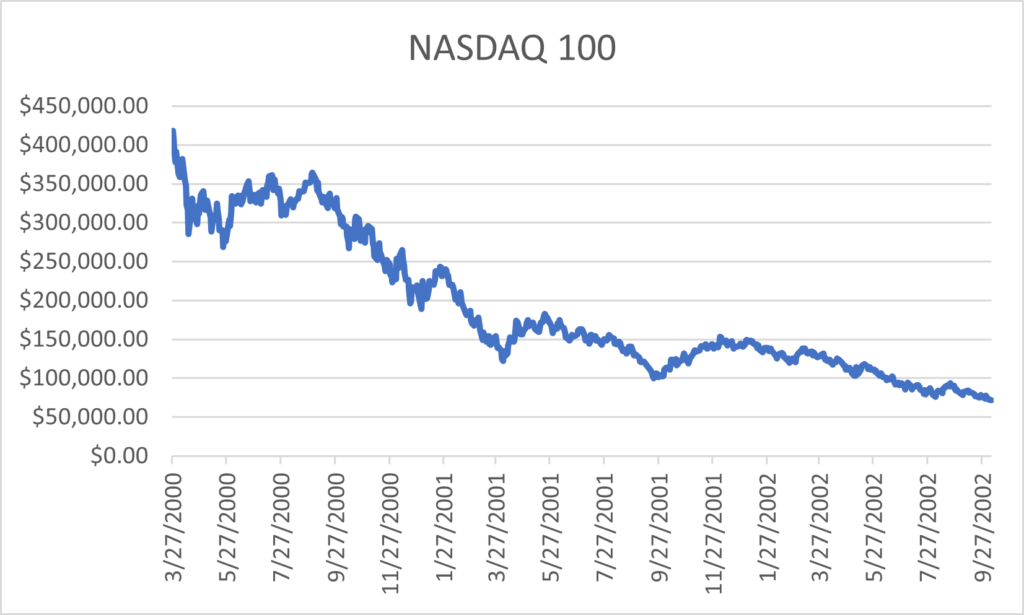
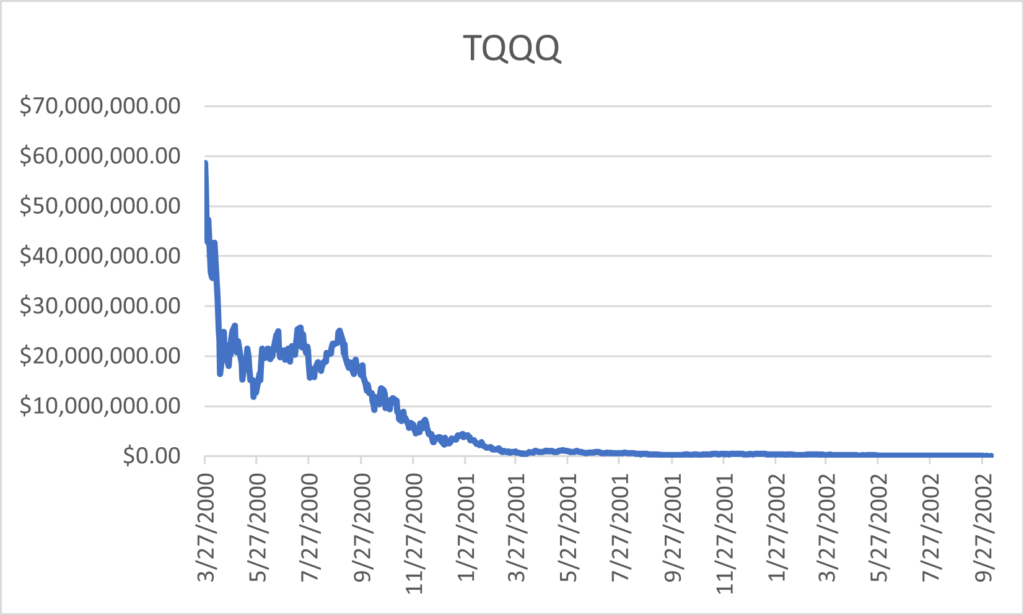
Out of all of the examples of market drops we’re using, this is by far the most extreme. If TQQQ had been around during this time period, it still wouldn’t have recovered to it’s previous high.
Financial Crisis of 2008-2009
The market had partially recovered over the next few years before the next event happened. By October 31st, 2007 our Nasdaq 100 investment would have reached $199,269. Our TQQQ investment would have gotten up to $397,019. But that was the highest it reached before the financial crisis caused at least partially by loose policy on mortgages.
The market continued to drop for a little over a year before it hit bottom on November 20th, 2008. On this date the value of our Nasdaq 100 investment would have fallen to $92,249, a drop of 53.7%. Our TQQQ investment would have fallen to a value of $23,909. This is a drop of 93.98% in a little over a year.
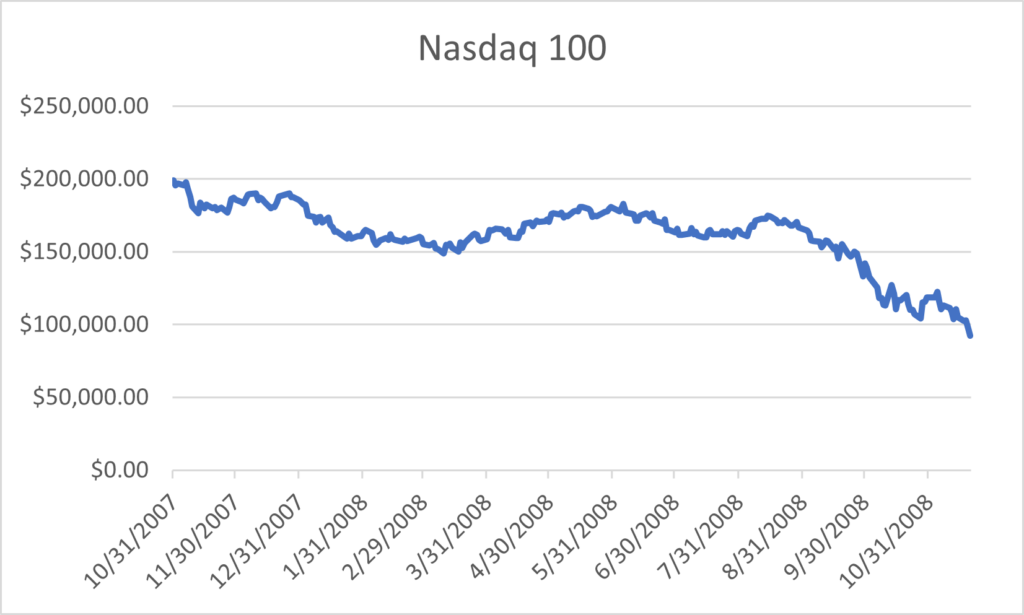
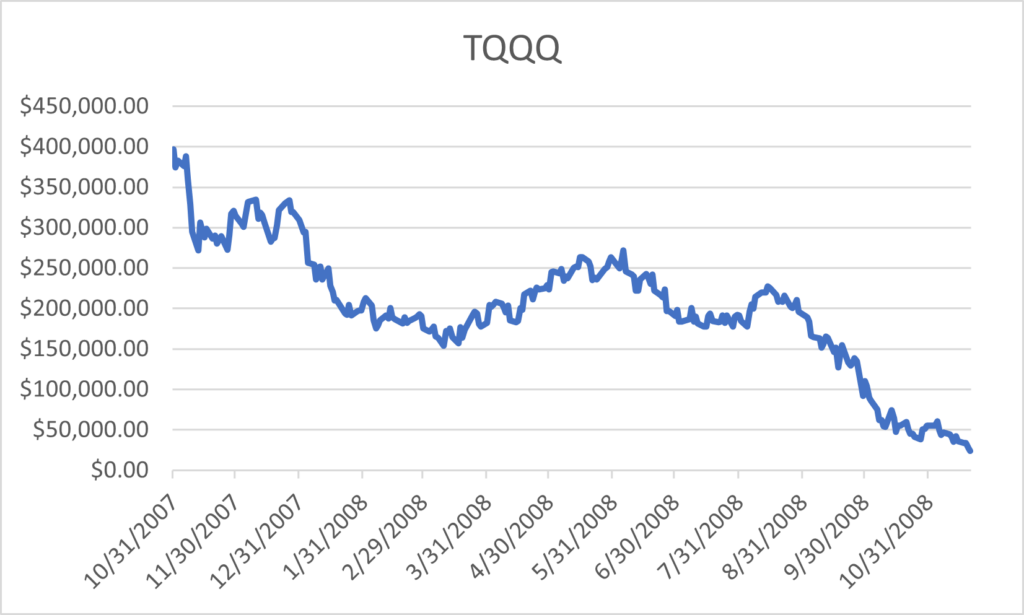
It would take until the first trading day of 2011 for the Nasdaq 100 to recover to the level it was at before the drop that started in October of 2007. But it still had a ways to go before reaching a new all time high. That wouldn’t happen until November 3rd, 2015. Because of how far TQQQ had fallen over the previous two downturns, it took until October 18, 2013 before it recovered to the level it would have been at before the 2008 crash.
Interest Rate Crisis of 2022
The next main crisis was much more recent. In 2022 the market crisis was caused by an increase in inflation and the subsequent increase in interest rates. You may have noticed that I didn’t mention the drop in the market from the Covid crisis. The reason is that even though the market did have a significant drop, it was short lived and the recovery time for TQQQ was only a few months.
By November 19, 2021 the Nasdaq had seen a fairly good run over the previous couple of years. On that date the Nasdaq 100 reached a new all time high which would have brought our investment value up to $1,475,027. Our TQQQ investment would have also done well, reaching a value of $17,674,361. This sounds pretty good if you don’t think about the fact that back in March of 2000 the value was nearly 60 million dollars.
Reaching the bottom
Once again, the market would go through a downturn which would last until it reached a bottom on December 28th, 2022. Our Nasdaq 100 investment would have fallen to a value of $950,461. This would be a decline of 35.56%. Our TQQQ investment would have reached a low of $3,377,118, a drop of 80.89%. It took until December 15th, 2023 for the Nasdaq 100 to reach another new all time high. TQQQ still hadn’t recovered fully from the downturn by the time we reached the end of our 39 year journey at the end of September of 2024.
As you have seen, when there are these downturns in the market, it takes longer for TQQQ to recover because of how much it has to come back up from the large drops. Even though in the long run you can see that at least over the time frame in our example that TQQQ does outperform the Nasdaq 100, there is a large amount of extreme volatility along the way.
Entry Point
One thing to consider is where in a cycle you purchase your shares at. If you were to purchase shares at a high point right before a market drop, it would take some time to recover your losses just to get back to your original investment level. If you had purchased shares near the peak of the dot com bubble, you’d still be at a fairly sizeable loss almost 25 years later.
Strategies to Reduce Volatility
You may be thinking, “It would be nice if we knew when there would be a market drop so I could sell my shares before the price went down and buy them back when it reached the bottom”. Unfortunately no one knows for certain when these market events will happen. But there are some things that can be done to take advantage of the leverage in TQQQ while minimizing the risk of the downturns. We have an article on what the results would be by using a Rebalancing Strategy with TQQQ.
Disclaimer
The content provided on Everyday Money Manager is information to help users become financially literate. It is neither tax nor legal advice. Nor is it intended to be relied upon as a forecast, research or investment advice. It is not a recommendation, offer or solicitation to buy or sell any securities or to adopt any investment strategy. Tax, investment and all other decisions should be made, as appropriate, only with guidance from a qualified professional. We make no representation or warranty of any kind, either express or implied, with respect to the data provided, the timeliness thereof, the results to be obtained by the use thereof or any other matter.
