I’d like to provide an update for June 2025 of our review on MSTY. The stock market as a whole has had at least a partial recovery from the tumble it took earlier in the year. The share price of MSTY has also had a partial recovery. The distributions are still in a very decent place when looking at the big picture. In this article we’ll be looking at the overall performance and how things are looking up to this point in time with MSTY. My original MSTY analysis can be found here: MSTY Review- High Yield Income Covered Call ETF on MSTR.
Share Price
Since our last update in March, the share price of MSTY has come up a little which has certainly helped the overall return of our investment. Here is the weekly chart for MSTY since it’s inception which helps to see the path that the share price has taken over the course of it’s life so far.
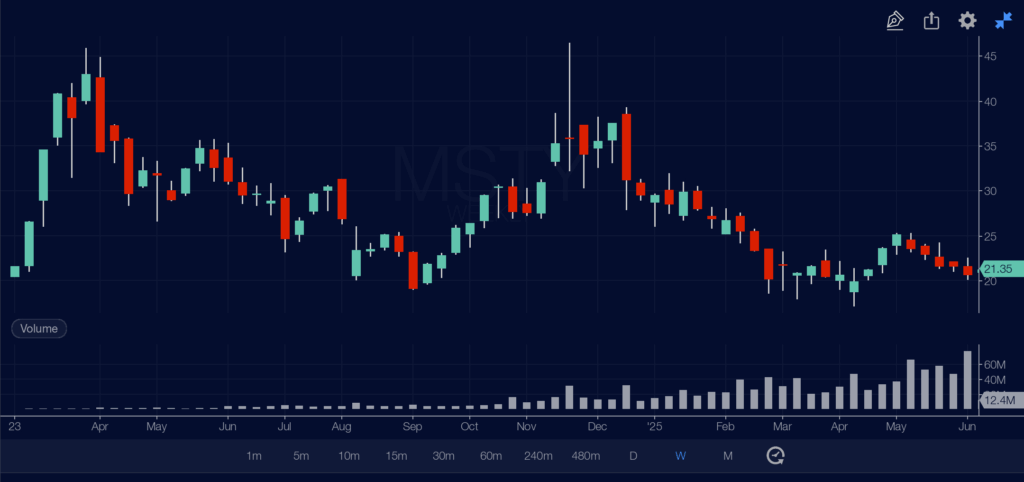
So the share price of MSTY is actually very close to the price it was when the ETF was launched. This is significant given the large distributions that are paid out.
Distributions Paid
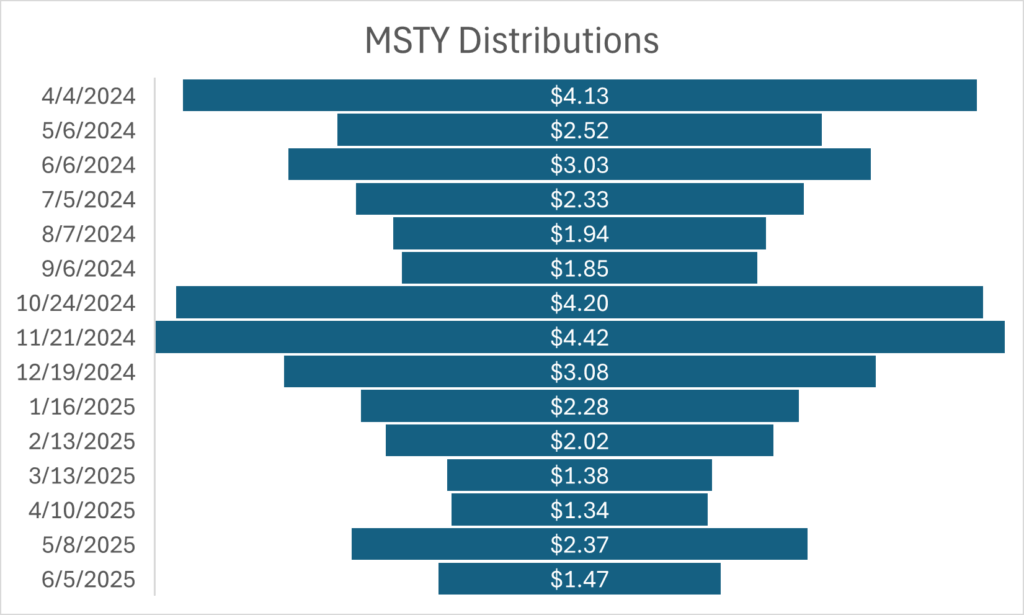
As we mentioned in our last update, the amount of each distribution has decreased some, but if the strategy is to reinvest the distributions, the total dollar amount received in distributions is increasing because of having a larger number of shares. Here is a chart showing the dates and amounts of each distribution per share since inception:
In the next chart you can see the distributions by total distribution paid out given the parameters that we purchased 1,000 shares when the ETF was first launched. This is also assuming we reinvested the distributions into more shares.

This is significant when you consider the fact that when looking at the distribution per share, the average of the first six distributions was $2.63 each. The average of the 6 most recent distributions was $1.81.
To put that into perspective the average payout from the total distribution average of the first six distributions was $3,208.33. The average of the six most recent distributions by total dollar amount was $5,178.03. So from this you can see that our monthly payout was higher even though the average per share distribution has gone down.
Summary
Using our example of starting with 1,000 shares and reinvesting the distributions, we would now hold 3,750 shares. Our initial investment would have been $20,380. The current value of our 3,750 shares as of the most recent ex dividend date would be $78,497.43. If we annualized the return on this up to this point that would be a 221.93% annualized return.