I often see comments about making sure when you’re selling put options to make sure to choose tickers that are stocks or ETF’s that you wouldn’t mind holding if needed for a long period of time. While this may be helpful to some degree, my thought is that you may be losing out on a lot of opportunities with higher volatility tickers.
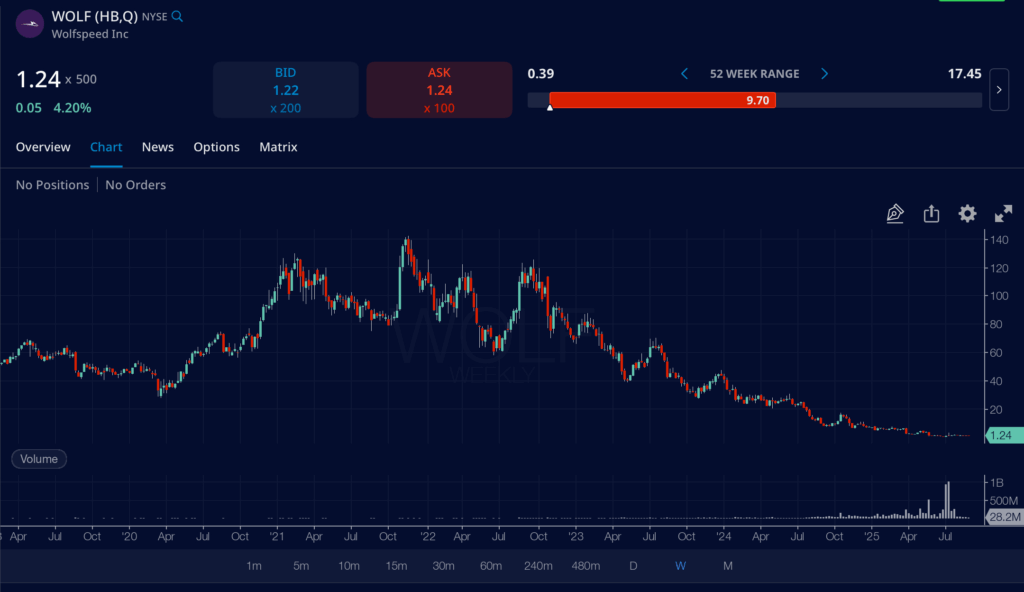
It is important to stay away from tickers where the price is in a long term downtrend. It’s also helpful to try and avoid tickers that look like they may be at the top of a range that the shares trade in. For example, one ticker that I ended up taking a loss on early in this process is one that probably should have been avoided. If you look at the longer term chart for WOLF you can see that it has mostly been in a longer term downtrend.
If you look at a chart for CONL you can see that it is very volatile and has ups and downs, but it isn’t in a longer term downtrend.
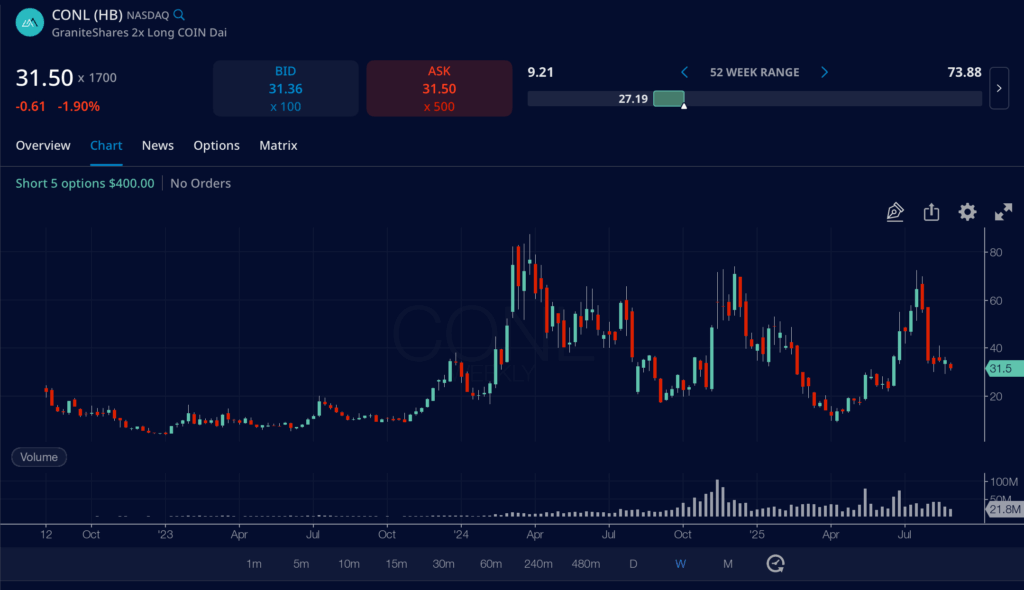
So with CONL for example, I had sold puts at $36 and $34 in the early part of this year. Following that the share price dropped along with everything else because of the tariff panic. So I ended up getting assigned on puts at $34 and $35. In April the share price of CONL dropped to as low as $9.21. My hope was that before too long the share price would recover so I could sell calls at the price that I bought the shares for.
By the June 20th expiration date for my calls, the share price of CONL ended above my call strike price and those shares got sold. Following that the share price went as high as $72.35 in July. I certainly didn’t want to sell puts when it was near the top. So I waited for the price to drop again which it did and I’m back to selling puts with strike prices around $32.
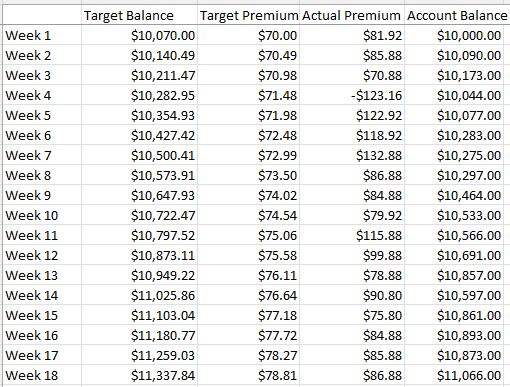
Week 18 Results
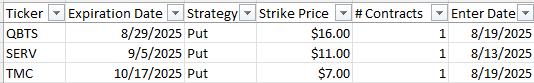
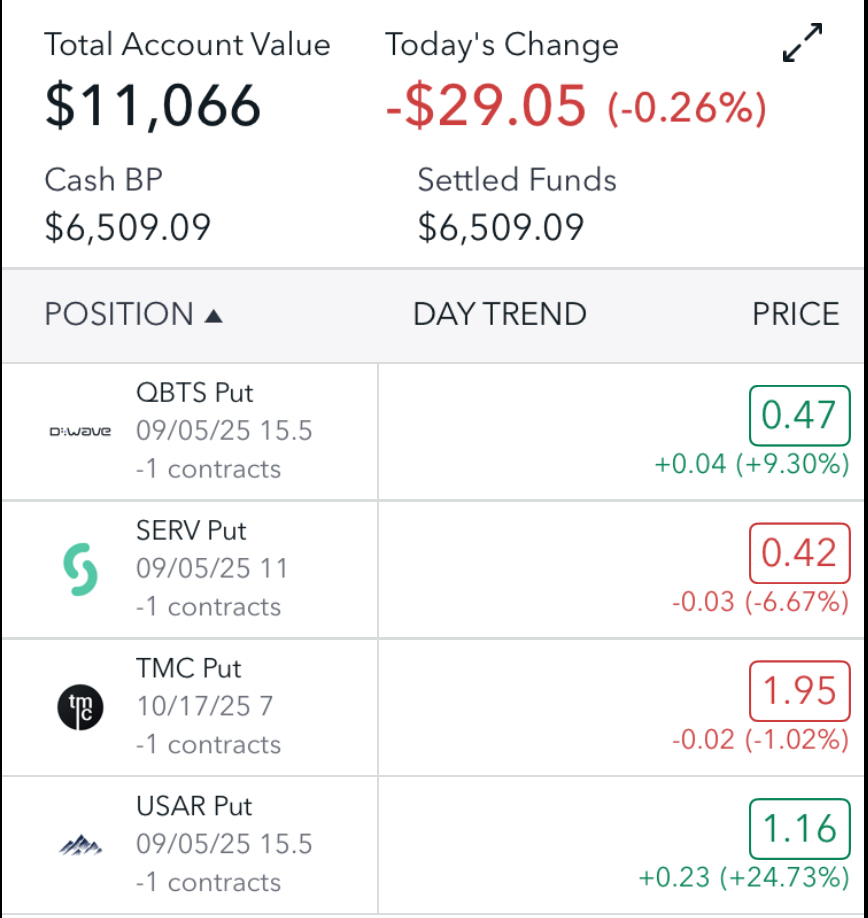
Here are the positions I started week 18 with:
I started the week out by opening a new position on Monday. I sold a put on USAR with a strike price of $15.50 and an expiration date of 9/5 (11 DTE). For this trade I was able to collect a premium of $85. The share price of QBTS had fallen below my strike some, but I was hoping it would recover at least somewhat as the week progressed.
The share price of QBTS did come up some through the week and even went above my strike price of $16 on Thursday, but by Friday it was just a little below my strike price. So I was able to roll it out one week and roll it down to a strike price of $15.50 and still collect a small premium of $2. I certainly would have gotten a higher premium if I had rolled to the same strike price, but rolling it down made it so it’s more likely that I can let the put expire next week.
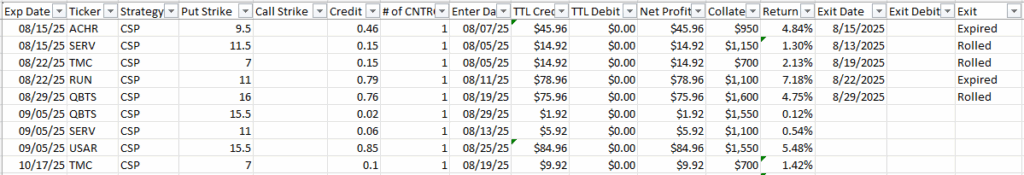
I was also glad to see that the share price of SERV ended the week above my strike price for the put that expires next week. So hopefully that holds and I can let my SERV put expire next week. Here is a chart of the trades I’ve placed for the month of August:
Summary
So after fees I was able to collect a total of $86.88 in net premiums for the week. My target for week 18 is $78.81. For the first 18 weeks I have collected a total of $1,460.80 and my target for the first 18 weeks is $1,337.84. I am currently using $4,900 of my cash as collateral for my open put positions. Here are snapshots of the summary and my account positions at the end of the week:
Read: How to Generate Consistent Profits Through Options Trading